For businesses spending $100K+/month on ads.

7.5X the ad spend. ROAS went up.

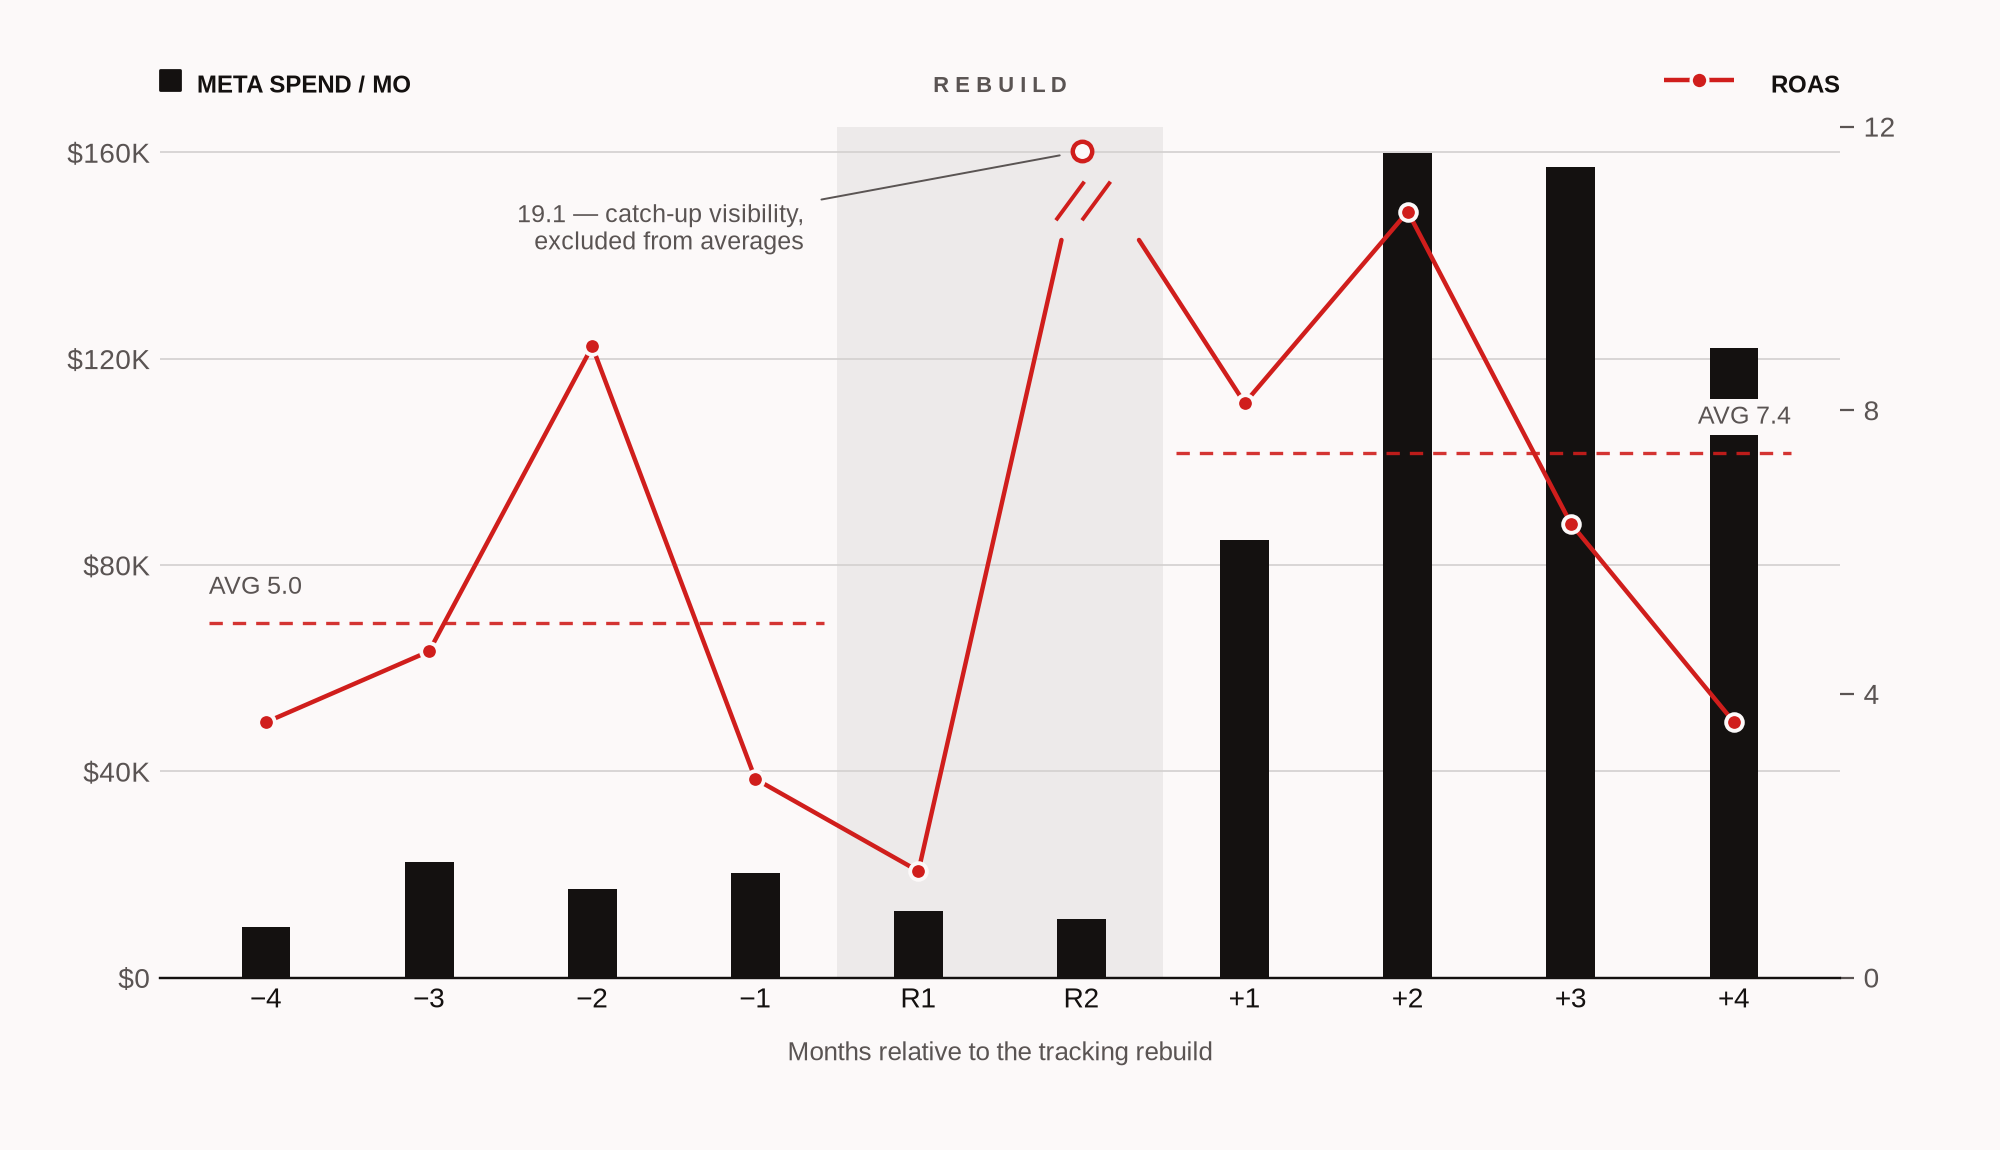
A high-ticket education business was spending about $17K a month on Meta. Within 90 days of us rebuilding their conversion tracking they were spending over $130K a month, and their ROAS was higher than before the scale-up: 5.0 to 7.4, from Meta's own reporting. Same offer. Same application funnel. What changed is what the ad platform could see.

Get the Free Case Study

Free. Six pages, from the platform's own exports.

01 The Numbers
7.5XMonthly Meta spend: ~$17K to ~$131K, averaged four months before vs. four months after the rebuild
5.0 → 7.4Meta-reported ROAS across the same windows. Up 48%, at 7.5x the spend
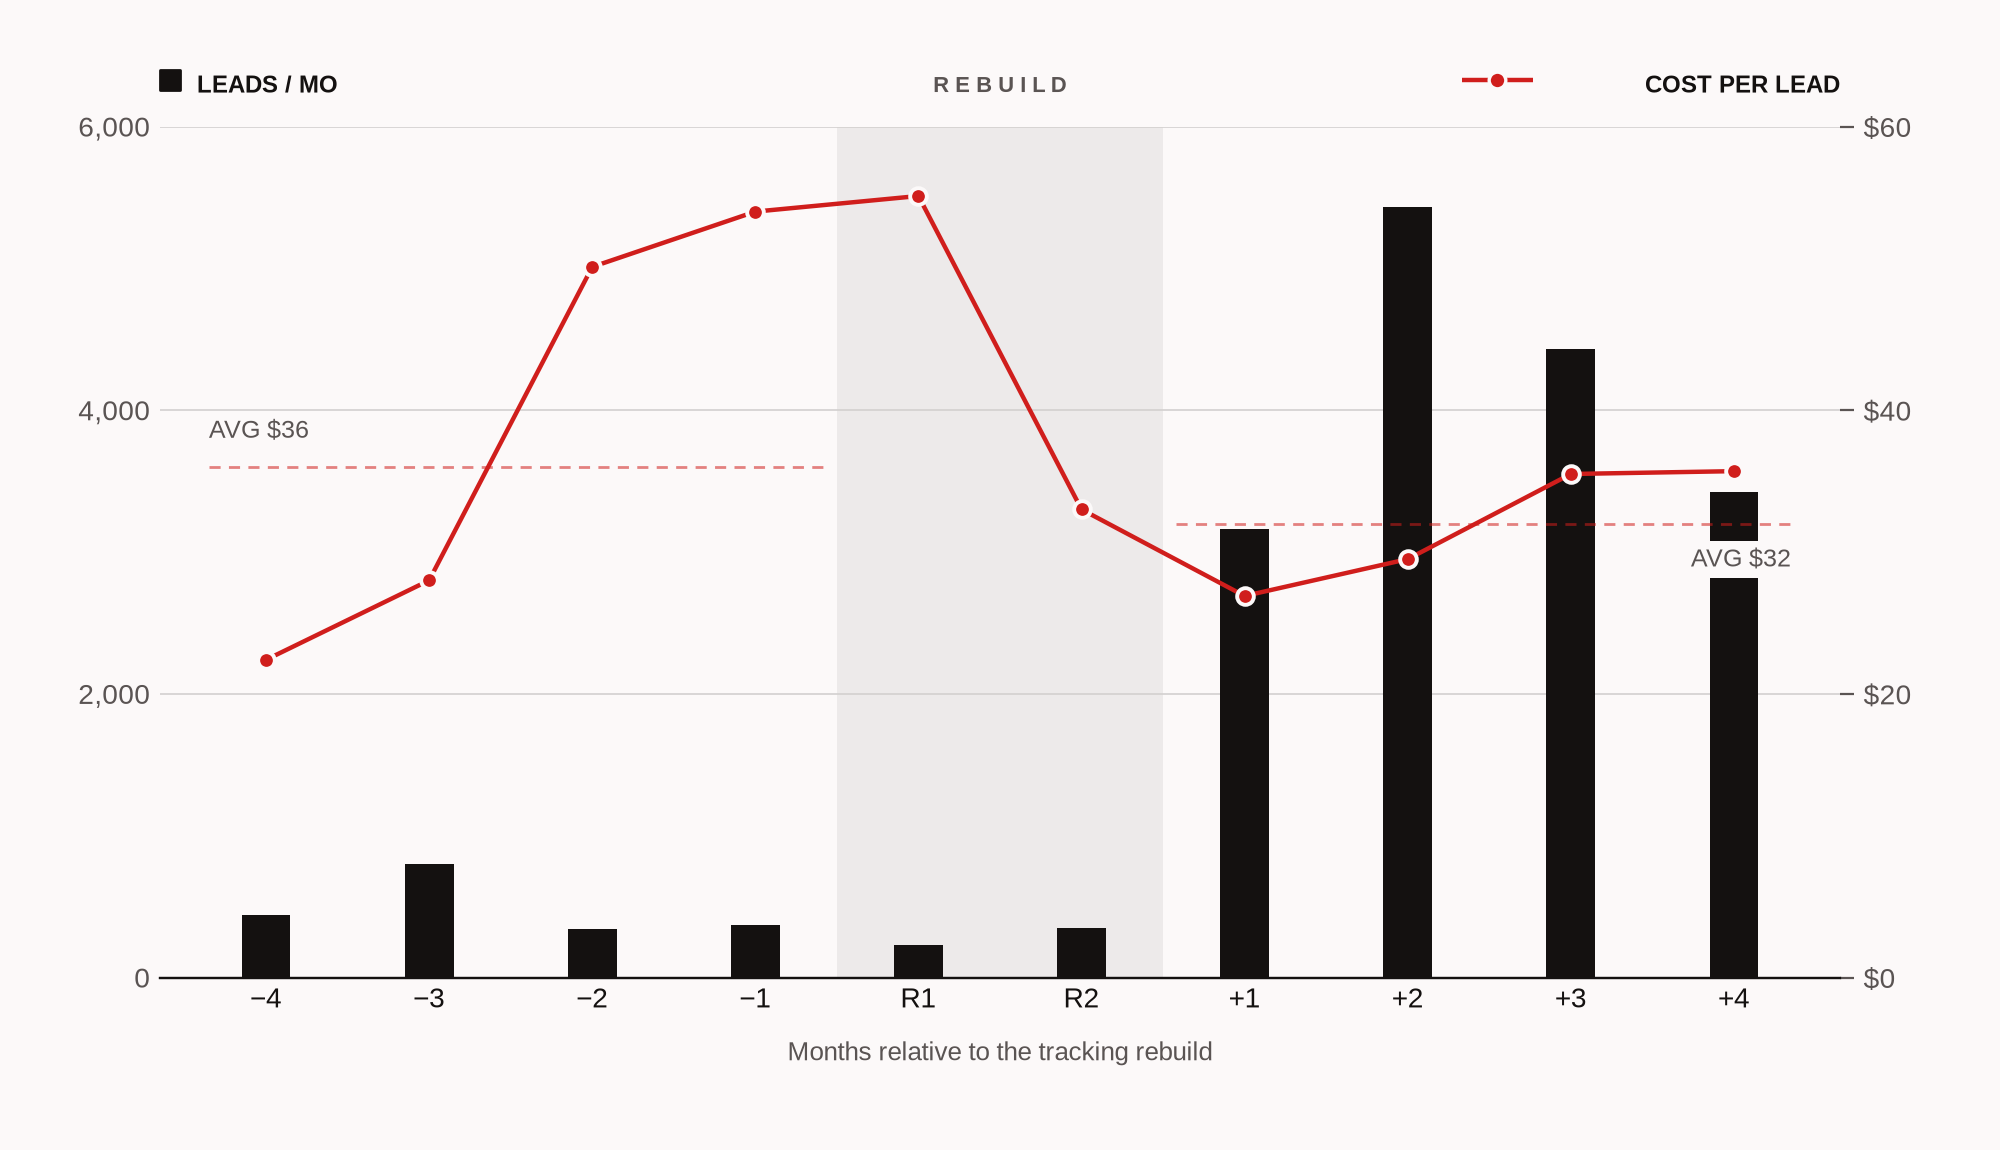
8XLeads per month: ~490 to ~4,100, with cost per lead down 10%
11 → 135Purchases per month, from the same export
02 Already Instrumented

If your funnel is on this list, I'm not learning your setup from scratch.

Twenty years of engineering plus ten years of media buying means the failure points repeat. These are funnels I've already tracked end to end:

01High-ticket coaching & expert programs
02Tech education
03Financial publishing
04VSL funnels
05Webinar funnels
06Application → booked-call funnels

The stack: GA4 · GTM (web + server) · CRM webhooks · server-side tracking · click-ID capture across Google, Meta, TikTok, Taboola, and YouTube.

03 Proof

The platform's own export.

Both charts are Meta's reporting: months labeled relative to the rebuild, all figures USD. The two rebuild months sit outside both averaging windows. One of them reported 19X ROAS as complete purchase data reached the platform for the first time; we treat that as catch-up visibility, not a result we'd sell you.

Chart: monthly Meta spend bars with ROAS line, four months before through four months after the tracking rebuild. Spend rises from roughly $17K to roughly $131K a month while average ROAS rises from 5.0 to 7.4. The 19.1 rebuild-month ROAS is marked as catch-up visibility, excluded from averages.
Fig. 01: Monthly Meta spend and ROAS, four months either side of the rebuild. Spend up 7.5x, ROAS up 48%.
Chart: monthly leads bars with cost-per-lead line over the same months. Leads rise from roughly 490 to roughly 4,100 a month while average cost per lead falls from $36 to $32.
Fig. 02: 8x the lead volume at a 10% lower cost per lead, same windows.
04 Free Case Study

How a $100K/Month Advertiser Broke Their Scaling Ceiling: 7.5X the Ad Spend at Higher ROAS in 90 Days.

The full before/after from Meta's own export, why the ceiling exists, and the three-step rebuild that broke it: quantify the blind spot, rebuild the signal, verify daily, then scale. If every budget raise makes your numbers worse, this is the case for fixing what the platform sees before touching another ad set.

No spam. Unsubscribe any time.

05 About

Boring verification that actually moves the needle.

Two careers that finally became one offer: 20+ years in software development, 10+ years in media buying. I started out selling media buying and funnels. Server-side tracking was just a differentiator I'd mention in passing, but every client kept buying me for the tracking. Over time, the tracking was the product. ROAS Architects is the result.

Meanwhile, the ground shifted under everyone. Client-side pixels, the standard for years, quietly broke under iOS and browser privacy changes. Most advertisers never noticed, because their dashboards still showed something. That gap between "showing something" and "showing the truth" is where budgets go to underperform.

"I'd rather tell you 'we can't explain 5 from our data' than invent a plausible story."

I run conversion tracking the way pilots run pre-flight checklists: not because something's wrong, but because at $100K/month a single overlooked detail compounds. I don't tell you it works. I show you, every day for 30 days, as your CRM and your ad networks reconcile in front of you. And I tell you first when something's off.

06 What I Work On

Three ways I keep your data true.

01

The Tracking Audit

Ten days inside your stack with full platform access: GA4, GTM web and server, ad networks, CRM. You get a professional report on the state of your tracking: what percentage of your sales each platform actually sees, quantified findings, and the action plan to close the gap. The same audit opened this case study's engagement.

02

Verified-Truth Implementation

The rebuild from this case study, per network: funnel events designed for accuracy of signal and signal velocity, deployed with zero downtime against production traffic, reporting real sales, not form fills. Then 30 days of daily ad-platform-to-CRM reconciliation where I show you it works, every day.

03

Monitoring & Optimization

Daily verification that the data stays true: you hear it from me first when something's off. Or the proactive tier: acting on what the data shows before it costs you a week of spend.

07 Is This You

Is this your account?

01Your CRM shows more sales than your ad platforms report
02Daily spend swings without explanation, and lead quality swings with it
03Growth flattened even though you raised budgets
04Clicks in the ad platform don't match sessions in your analytics

Two or more of those, and you likely have your own blind spot. You can't scale on numbers you can't trust, and you can't fix what you haven't measured.

Get the Free Case Study