For businesses spending $100K+ a month on ads
7.5X the spend on Meta. Blended ROAS from 2-3X to 4-5X.
Total ad budget did not change. The client's own books, across every channel they run. Scaling is supposed to cost efficiency. On this account it didn't, because the collapse was never coming from the market. It was coming from what the algorithm couldn't see.
You have the capacity. The team could handle twice the clients tomorrow. So you buy the traffic to fill it, and every time you do, the math falls apart. CPA climbs. ROAS sags. You pull the budget back down, and the numbers recover, and you're back under the same ceiling, a little more tired than last time.
You've been told why. Audience saturation. Creative fatigue. Auction pressure. Diminishing returns, the law of paid traffic.
Here's what nobody told you.
When you scale, your first dollars spend against the platform's clearest signal. The incremental dollars, the ones you added to grow, spend against its guesses. If the platform can only see a fraction of your buyers, then more budget doesn't buy more buyers. It buys worse guesses, at a higher price, and your blended numbers report that as "scaling doesn't work."
The ceiling was never the market. It was the sample size.
I got to measure that on one account. A high-ticket education business, over $100,000 a month, application funnel, setters and closers, stuck under the same monthly ceiling for a year. I rebuilt the conversion tracking on Google and Meta at the same time, so both platforms were finally being taught what the CRM already knew: which clicks became applications, which applications showed up, which calls became money.
One piece of it, so that "better data" means something you can picture. I asked their sales team a single question: what tells you, before the call ever happens, that a lead is real? They answered without stopping to think. Leads who replied yes to the confirmation text showed up 60 to 70 percent of the time. Leads who never replied almost never showed. The sales team had known that for years. Nobody had ever told Meta. So I did.
Then the client did the thing that's supposed to be impossible. They put 7.5 times the spend into Meta.
Returns went up.
The 7.5x was not the trick. The trick was giving the platform enough of the right conversion data to survive 7.5x.
You are probably here because one of these is true of your account.
- Your ad platforms report fewer sales than your CRM books, and the gap does not close.
- Your spend has been flat for months, because nobody can prove the next increment would pay.
- You have tried to scale, and efficiency collapsed every time you did.
My best month on this account printed 19X. I threw it out of every average here: it was months of purchases reaching the platform at once the moment it could finally see them, which is catch-up, not a result.
At this scale you can't afford for your data to be wrong.
Find out what your platforms can't see. That is the size of your ceiling.
Every week you wait is a week of spend bought on the numbers you already have.
Send me one landing page for each traffic source you run.
I put test enquiries through your funnels, then tell you every enquiry I sent and which of them your platforms actually saw.
You get that in writing within two business days.
No account access. No cost.
If nothing is broken from outside, the report says that.
01 THE RESULT
What the numbers did
The client's own figure, from their own books. Not independently verified.
That is the business, out of its own books. Below is the same period as one platform graded itself.
A spreadsheet can show you where to spend. Only the signal can teach Meta who to find.
That is why this was not a channel switch anybody could have made from a spreadsheet. A monthly report of sales by source would have shown that YouTube was not converting. It would not have taught Meta which people to go and find. Feeding the platforms the CRM's truth changes what the bidding does with every dollar once it gets there. That is what made the move survivable: YouTube's spend came down by about 88 percent, the money crossed to Meta, totals stayed flat, and the channel absorbing 7.5x the spend got more efficient, not less.
Some of that lift is the platform finally being told about sales the business was already making. That is not the small print, it is the point. An ad platform bids with what it can see, and this one had been bidding on a fraction of the business for a year. Give it the whole picture and it spends your money on the people who actually buy.
02 THE MECHANISM
What was rebuilt
Traffic was never the problem. The count of what that traffic turned into was wrong, and the ad platforms were bidding on the count they had.
First, the size of the gap
Nothing was changed until the gap had a number on it: how much of the business each platform could actually see, counted against what the CRM had booked. An ad account is the wrong place to measure its own blind spot, so the count started outside it.
The biggest gap was not a leak. Nothing was escaping, because nothing was being sent. The sales themselves, the calls a setter closed and the payments taken weeks after the click, reached the ad platforms not at all. There was no route for them to travel. So the platforms were bidding on a thin count of the cheapest events, none of the expensive ones, and guesswork for the rest. That is the difference between the algorithm guessing and knowing, and it decided the order of everything below.
Once the new tracking was live, that gap was counted every morning against the client's own backend, day by day, until it closed.
Then, what the platforms were told
The rebuild started with the definition of a lead. The platforms were being told about form submissions, and a form submission and a person the sales team would want to call are two different populations. Every route into the business had to report the same conversion, on the same terms, before anything downstream was worth tuning. Most stacks have never actually had that: web forms count one way, the CRM another, and nobody reconciles them. I call it The Complete Count, and the rest of the work sits on it.
Then I widened what the platforms hear about. The account started reporting the moments either side of the sale as well: a call attended, an email opened. A buyer takes weeks to travel from a click to money, and a platform told about the money and nothing else gets one lesson per buyer, late. Feeding it the earlier moments gives it something to learn from while the buyer is still moving.
I do not guess at those earlier moments, and I do not invent them either. That confirmation-reply signal came out of the sales team's own answer, not out of a tracking plan. That reply became one of the events the platforms learn from, ahead of the sale itself. A form submission isn't a lead. A reply is a person.
The rebuild itself went in without losing a lead. Every enquiry that arrived during the changeover was still there afterwards.
Then, checking it daily
For the first month after go-live the numbers were reconciled every morning. A break would have reached somebody who could act on it the same day, while there was still only a day of spend behind it.
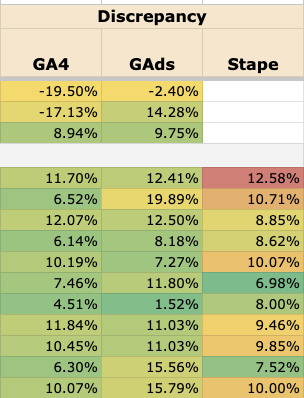
Everybody in this market promises daily verification. This is the only page I know of that shows you the sheet.
Last came a count against a count: what the platforms reported for a period, held up against what the CRM had booked for the same period. Platform totals and CRM totals that agree, and go on agreeing month after month. I call it Parity Lock.
03 WHO IS DOING IT
Who runs this
Twenty years building software, ten years buying media. I started out selling media buying and funnels. Clients kept buying me for the tracking instead, so the tracking became the product.
I run conversion tracking the way pilots run pre-flight checklists. Not because something is wrong, but because at $100K a month one overlooked detail compounds.
The first step needs access. What I will do on your account for nothing is the outside-in version: I walk your funnels myself, from where your buyers stand. This is for accounts spending $100K a month and more.
Get the free report04 THE WITNESS
What the client said
Our tracking now is absolutely on point. We went from 2-3X ROAS to 4-5X ROAS…
Results are from one client's own ad-platform data and are not a guarantee of future performance; individual results vary.
05 THE LIMIT
Where my work ends
I rebuilt the conversion tracking. The 90 days after that are what it bought: both platforms reporting what the CRM had already booked, and an account that could be scaled on numbers somebody had checked daily. What the ROAS did a year later belongs to whoever was buying the media. I do not claim it.
What that is, in order. First the audit, and it is deliberately quick: I count what each platform actually sees against what your CRM booked, network by network, and I stop counting the moment I know what to fix. You are bleeding budget while we measure, so the audit is there to aim the work, not to produce a document. Then the rebuild, per network, deployed against live traffic without losing a lead. Then 30 days of daily reconciliation you watch happen. After that it is monitoring, because tracking is not something you install, it is something you keep true.
06 YOUR ACCOUNT
What I can see without touching your accounts
Whether the plumbing exists at all: whether a server-side endpoint is there, how thin your event coverage is, whether your forms fire anything, whether any Conversions API signal leaves at all, and whether the thing you call a lead event is really just a page view wearing its name.
What I cannot do from outside is size it. Following a handful of test leads through your funnel shows you the breaks; putting a number on how much of your business each platform is missing, across every campaign you run, needs to be inside both. That is the paid work, and it is worth talking about only after a free report has shown you something real.
And if nothing is visible from outside, I tell you that too. Your gap, if you have one, is internal. I would rather send that report than invent a problem.
Find out what your platforms can't see. That is the size of your ceiling.
Every week you wait is a week of spend bought on the numbers you already have.
Send me one landing page for each traffic source you run.
I put test enquiries through your funnels, then tell you every enquiry I sent and which of them your platforms actually saw.
You get that in writing within two business days.
No account access. No cost.
If nothing is broken from outside, the report says that.
For accounts spending $100K a month and more, where even a small signal gap distorts a meaningful amount of spend.
Get the free report